Why do you need another market impact model?
By Hitesh Mittal
I have always thought that a robust market impact model is more important than building a better execution algorithm, even though the latter is our bread and butter.
There are two major use cases. The first is portfolio construction, mostly for systematic asset managers, and the second is execution optimization, for execution quants on both the buy side and sell side.
Portfolio construction
For systematic managers, the annualized expected return for any given stock is generally comparable to the expected cost multiplied by annual turnover. But at most systematic firms, 99% of the research budget is spent estimating expected return while accurately estimating expected costs is typically a side project.
Ultimately, portfolio construction should focus on expected returns net of expected costs. As a result, not having a robust market impact model means that portfolio construction itself is inefficient.
While the whole world focuses on "implementation shortfall" (the loss in return due to the difference between execution price and "decision price"), I think the true implementation shortfall is a lot larger. If the expected cost of implementation is not accurately estimated, the portfolio itself is being constructed using inaccurate inputs.
In my experience, most managers compare the overall estimated cost with actual costs to see whether their model is accurate. But even if it is, that comparison alone is not sufficient.
If your model estimated 15 bps of average slippage and your actual cost last year was 15 bps, is that model good? Not necessarily.
While getting the overall level right is important, arguably the relative costs of trading different stocks are even more important. For example, if your portfolio does 50% of its trading in large cap and 50% in mid cap, and your model estimates that a 1% ADV order costs 10 bps for large cap and 20 bps for mid cap when the "true" costs are 5 bps and 25 bps, the average is the same. But the errors will still lead to inefficient portfolio construction.
Market cap is just one example. Costs differ across many dimensions, including volatility, volume, order size, execution time, and speed.
And there are other use cases for high-turnover systematic firms as well. How will expected returns change as they scale the size of a strategy? For a brand-new strategy, how can they backtest effectively while taking expected trading costs into account?
Execution optimization
The second use case is execution optimization, which applies to everyone.
Most execution desks focus on optimizing the duration or speed of a trade. But speed is just one aspect of transaction cost. T-costs vary based on when you execute, trade size, and speed.
I think the time-of-day effect is one of the least researched areas of cost, which is a major reason why most models cannot really be used for execution optimization.
You can trade an order three times faster in the afternoon and still achieve lower slippage than trading it more slowly in the morning. But most t-cost models fail to model that interaction.
The reason for the gap is that most algorithmic trading databases are polluted with the behavioral biases of how the orders have actually been traded. Most portfolio managers generate their orders in the morning. Trading desks mostly deploy one of two styles of strategies, liquidity-seeking/participate/implementation shortfall strategies that trade aggressively or VWAP strategies that spread the orders out.
That means orders traded at higher speed are also more likely to be the ones traded in the morning. Since most models do not try to disentangle the time-of-day effect from the speed effect, the speed effect is exaggerated and the time-of-day effect is underrepresented.
The same goes for the relationship between size and speed.
It is unlikely that a 10% ADV order will be traded at a participation rate much lower or much higher than 10%. On the other hand, there will be plenty of observations where a 1% ADV order is trading at a 2%, 5%, 10% or 20% participation rate.
Consequently, when these models are built, the speed effect can really end up representing smaller orders rather than larger ones. Can that model really be trusted for predicting the cost of both kinds of orders?
I think most PMs and traders ultimately have strong intuition around these challenges. They inherently do not trust these models for portfolio construction, nor for execution optimization. The end result is that they protect their orders with rules of thumb, such as adding volume caps and participation rates to their execution strategies.
Many of our clients have realized that time of day is extremely important and choose to run A/B tests between "backloaded" schedules and VWAP, for example. But how backloaded the schedule should be is an open question, and A/B tests require months of testing.
I am a big believer in A/B testing because the ultimate truth is how the algorithms actually perform. But given the amount of time it takes to run an A/B test, it is better to start with well-informed experimental design.
For example, if your model suggested that the optimal start time is 2 PM for mid-cap orders and 3 PM for small-cap orders, starting with that as strategy B is is likely to yield meaningful results faster than using an arbitrary start time.
Existing t-cost models
Today, t-cost models are offered by two types of firms.
There are paid models offered by a couple of well-known TCA firms. However, the use case they solve is not necessarily portfolio construction or execution optimization. I haven't met a single firm that uses them for those purposes. Rather, they are generally used as a TCA benchmark to grade a firm's own costs against "expected" costs and report execution quality from a compliance perspective in best execution committees.
Because these tools are primarily used for grading rather than portfolio or execution optimization, I think the bar for quality is low.
Banks also offer t-cost models for free to their trading clients, often delivered in the form of spreadsheets.
Regardless of whether the models are offered by TCA firms or banks, there is generally very little transparency around how they are built and, more importantly, very little published data on out-of-sample predictions across time of day, speed, size, liquidity bucket, market conditions, etc.
How is our model different?
The main differentiation is the purpose for which it was built. It was built to help our clients construct better portfolios and optimize how they use our algorithms, including decisions around duration, speed, time of day, etc., rather than simply benchmarking execution after the fact.
Why do we believe our model is better suited for portfolio construction and execution optimization than the models out there? And how do we solve the issues related to confounding factors such as speed vs. size and speed vs. time of day?
We took an entirely different approach.
Instead of relying just on our own algorithmic trading database, which contains millions of parent orders traded across various market conditions over the last five years but suffers from the same issues that other institutional trading databases do, we use a hybrid of meta orders generated from TAQ data and our own execution data.
Meta orders are essentially buy-sell order flow derived from TAQ data, which allows you to construct the net demand and supply for a particular stock within a specific window.
The use of meta orders is not new. Plenty of academic papers use that approach to explain market impact sensitivity to size, speed, etc., including some of the earliest papers by Almgren. But there has been little proof that meta orders alone can actually explain the market impact of institutional orders particularly well.
And they don't, not entirely.
So we took a hybrid approach.
We use meta orders to derive the sensitivity to various factors, particularly the more complex aspects of t-cost models that require a ton of data and that an institutional trading database will never explain well. We then use the institutional trading database to derive the overall cost level, as well as spread and adverse selection costs.
Out-of-sample results
As they say, every model is good...until you see the out-of-sample results.
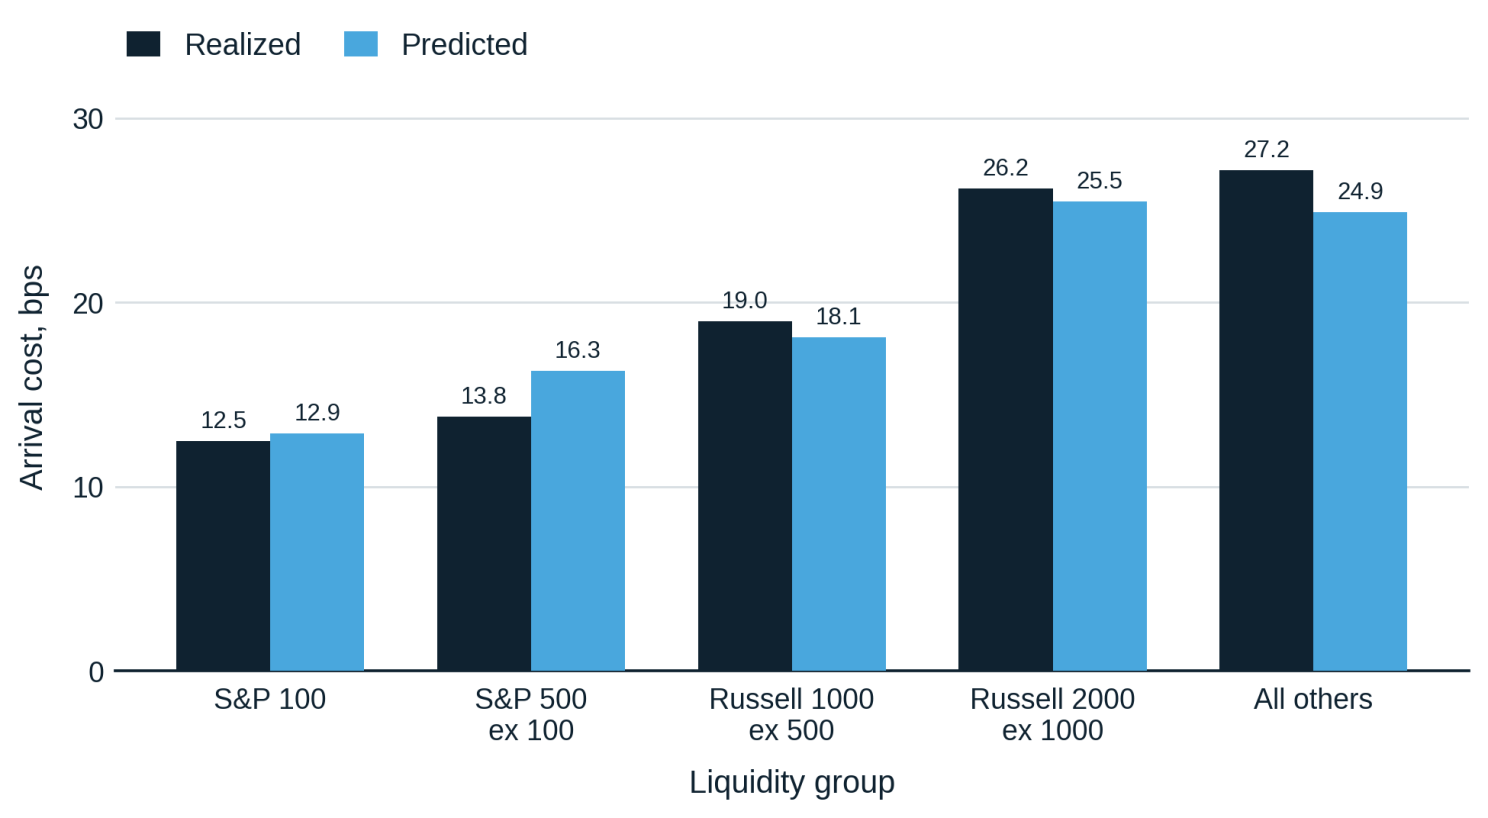
And that's what we are most proud of. We used 2025 as the test period and tested the model predictions against our own trading data. We tested whether the model not only predicts the overall level of trading costs well, but also predicts costs accurately across different times of day, stock liquidities, execution speeds, order sizes, and months.
The overall predicted cost was within 0.05 basis points of actual costs, on average.
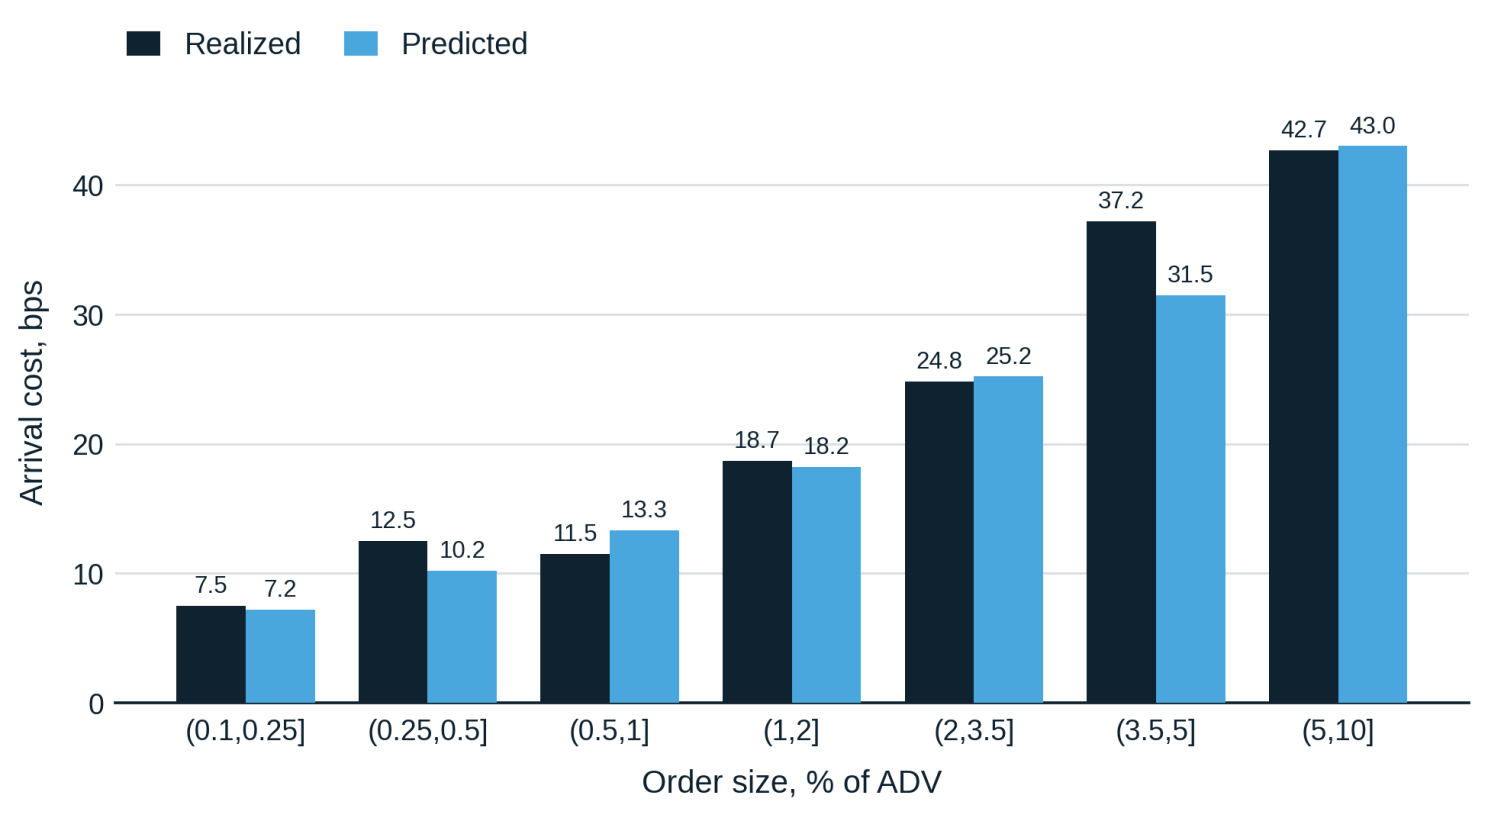
Realized versus predicted cost against arrival by order size, 2025 out of sample (267,680 orders). Dollar-weighted average, in basis points.
The model also worked consistently across S&P 100, S&P 500, Russell 1000, Russell 2000, and stocks outside the Russell 3000. It also did surprisingly well in April 2025, when market conditions were extremely volatile around the U.S. tariff announcements.
Delivery and support
But our model's delivery and support are as important as the model itself.
Because the model is built for portfolio and execution strategy optimization, it is delivered via a rich API. The API allows bulk calls and estimation of different execution strategies, including VWAP, Close, POV, Must Complete vs. not, and more.
Many PMs require point-in-time estimates not just for cost, but also for analytics like estimated volume, spread, opening and closing volume, dark vs. lit volume, and net order flows, for example. So we provide five years of historical data to allow extensive backtesting at any resolution above one minute. The product also includes enhanced one-minute bar data and the full security master, including lot sizes, tick size, exchange hours, etc.
Execution researchers can easily run what-if scenarios to determine the optimal execution strategies within their constraints. For example, what is the expected cost of trading a backloaded schedule versus a front-loaded schedule?
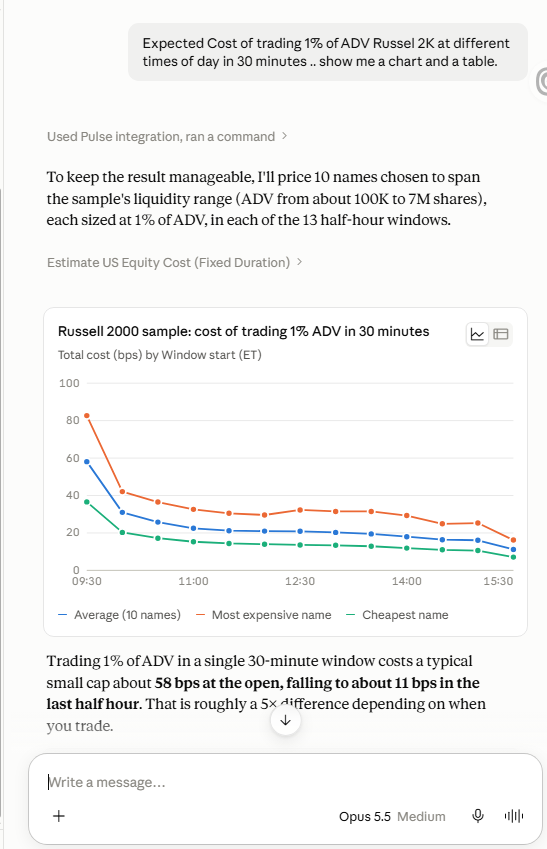
Pulse also contains an MCP connector that makes it surprisingly easy to explore liquidity, strategies, and market conditions by simply asking questions with your existing AI tools rather than turning each question into a research project.
For example, one prompt I ran was "How has the cost of trading a Russell 3000 1% ADV order changed over the last five years?" It gave me a useful chart within a minute.
Or "What is the cost of trading a 1% ADV VWAP for mid-cap stocks starting at 9:30 vs. 10:00 vs. 10:30, all the way through 3:30 to the close?"
Or something as simple as "How much do you expect will trade in the closing auction today?"
And of course, we've integrated a sophisticated front end with AMS One that all of our clients can access for free.
The API product, along with the MCP interface, is a paid product and we will continue to enhance it. Next up are an MOC-only market impact model and an ETF-specific market impact model.
More information about the model, the API, the MCP connector, and the white paper are on our website.
We would be happy to set up a time to discuss the model and answer your questions.